Market Overview
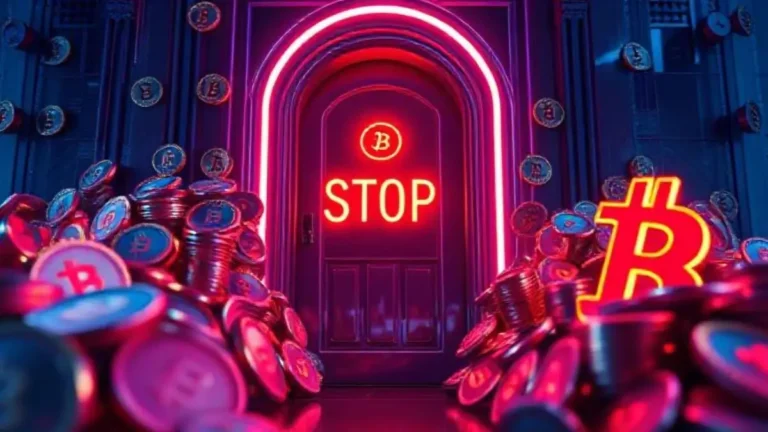
Bitcoin (BTC) traders are buzzing as a classic technical indicator points to an imminent price explosion. On March 25, 2025, analysts observed that Bollinger Bands—a volatility gauge—have squeezed to their tightest since late 2023, suggesting a breakout could be near. With Bitcoin trading at $87,700 and riding a wave of U.S. policy support, the setup hints at substantial upside, though some warn of a potential trap in a market notorious for volatility. Here’s a deep dive into the factors driving this moment.
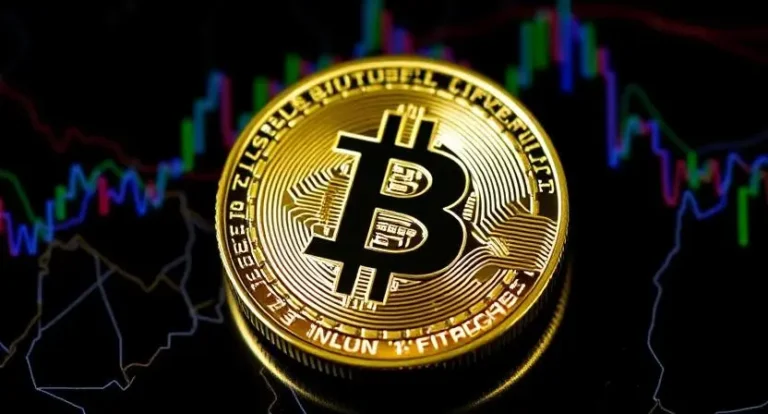
The crypto market is electric in Q1 2025, fueled by macroeconomic and regulatory tailwinds. Bitcoin, the $1.7 trillion king of digital assets, has climbed 70% since President Donald Trump’s March 6 executive order established a U.S. Strategic Bitcoin Reserve, including BTC alongside Ethereum, XRP, Solana, and Cardano. BlackRock’s European Bitcoin ETP launch, with a 0.15% fee waiver, has injected institutional momentum, pulling in $535 million in a week. Meanwhile, Strategy’s 500,000 BTC treasury, valued at $47 billion, and GameStop’s rumored BTC pivot keep corporate adoption in the spotlight. U.S. inflation at 2.8% yearly bolster BTC’s “digital gold” narrative, setting a bullish stage.
Yet, risks linger. A 16% BTC drop in 30 days earlier this year and ongoing regulatory flux—like the SEC’s Crypto 2.0 Task Force—remind traders of the market’s dual nature. The $2 trillion crypto market cap hums with $100 billion in daily volume, primed for a jolt.

Key Price Levels and Support/Resistance
Bitcoin’s price action hinges on critical thresholds. The current level of $87,700 sits just below a major resistance at $90,000—a psychological and historical ceiling tested in late 2024, where sell-offs capped gains. Breaking this could open a path to $100,000, a level last teased in 2021’s peak. On the downside, support lies at the 200-day SMA of $74,000, a line that held firm during February’s dip. The 50-day SMA at $82,500 offers nearer-term footing, while $70,000—a former resistance turned support—looms as a deeper floor if momentum falters. Traders eye $88,000 as a near-term pivot; clearing it could signal bulls are in control.
Technical Indicators and Chart Patterns
The Bollinger Bands squeeze steals the show. With the 20-day SMA at $85,200 and bands narrowing to a 5% range (down from 15% in January), volatility has cratered—a classic precursor to big moves. Past squeezes in 2016 and 2023 triggered 200% and 40% rallies, respectively, though 2018’s saw a 50% crash. The upper band at $88,900 and lower at $81,500 frame the breakout zone—breaching either could set the direction.
Other indicators add context. The Relative Strength Index (RSI) at 68 nears overbought territory (above 70), suggesting caution but not exhaustion. A golden cross—the 50-day SMA crossing above the 200-day in February—underpins the uptrend, while a rising wedge pattern on the daily chart hints at consolidation. If BTC breaks upward, analysts see a measured move to $105,000; a downside break could test $70,000. “The squeeze is textbook,” an analyst noted. “Volume will decide the winner.”
On-Chain Metrics
On-chain data paints a bullish picture with caveats. About 85% of BTC hasn’t moved in three months, a hodling trend echoing pre-2020 spikes when supply tightened before rallies. Miner outflows have dropped 30% since February, reducing sell pressure as miners—key players in BTC’s ecosystem—hold rather than dump. Stablecoin inflows, like $2.6 billion in USDC over 30 days, signal cash waiting to pounce, a liquidity boost for buyers.
Wallet activity shows mixed signals. Whale transfers of 3,000 BTC to exchanges on March 23 suggest potential sales, but accumulation addresses (holding over 1,000 BTC) grew 5% in Q1. The Network Value to Transactions (NVT) ratio, a price-health metric, sits at 60—moderate, not overheated—while the MVRV ratio (market cap to realized cap) at 2.8 hints BTC is fairly valued, not in bubble territory yet.
Market Sentiment and Social Media Analysis
Sentiment is heating up. On X, “Bitcoin breakout” trended March 24-25, with bulls like Kevin Svenson predicting $110,000 and bears like Peter Brandt urging caution at $90,000 resistance. The Cohen-Saylor photo from March 22, tying GameStop to BTC, spiked chatter—#GameStopBTC hit 50,000 mentions in 48 hours. LunarCrush data shows BTC social volume up 40% week-over-week, with 65% positive sentiment, though “scam” and “crash” mentions linger at 10%.
Reddit’s r/CryptoCurrency buzzes with Bollinger talk, while Telegram trading groups push leveraged long bets. Google Trends pegs “Bitcoin price” searches at a six-month high, rivaling 2021’s peak. Fear & Greed Index sits at 72 (Greed), down from 80 in February, suggesting optimism tempered by wariness. “The crowd’s loud but not reckless,” an observer remarked.
Trading Volume and Liquidity
Volume tells a compelling story. BTC’s 24-hour trading volume hit $48 billion on March 24, a 20% jump week-over-week, reflecting heightened activity. Futures open interest spiked to $32 billion, with 60% of positions long—a bullish tilt, though short liquidations ($120 million last week) show bears getting squeezed. Spot market depth on exchanges like Binance and Coinbase holds steady, with $500 million in buy/sell walls within 2% of $86,700, per order book data.
Liquidity benefits from ETF inflows—$35 billion into U.S. spot BTC ETFs in 2024—and stablecoin reserves, cushioning price shocks. Deribit’s options market shows $90,000 call strikes leading March expiries, with implied volatility at 55%, up from 40% in February. “Liquidity’s there to support a move,” a trader noted, “but it’s not infinite.”
Short-term Price Predictions
Analysts split on BTC’s next step. Optimists see the Bollinger squeeze and policy tailwinds pushing past $90,000 by mid-April, targeting $100,000-$110,000 if volume sustains above $50 billion daily. “Clear $88K, and it’s off to the races,” one predicted. PlanB’s Stock-to-Flow model backs this, eyeing $120,000 by year-end. Bears counter that $90,000 resistance, whale sales, and an RSI near 70 could trigger a pullback to $80,000 or $74,000 if the squeeze flops downward—a 2018 redux.
Consensus leans bullish but cautious. A break above $88,900 with 25% volume growth could confirm $95,000 in two weeks; a drop below $81,500 risks $70,000 by April’s end. “It’s 60-40 upside,” an analyst estimated. “The bands don’t lie—but the market does.” For now, Bitcoin’s coiled, and traders are watching.
Disclaimer: The information provided on or accessed through TrueToCrypto.com (the “Website”) is for general informational purposes only and is obtained from independent sources that are believed to be reliable. However, TrueToCrypto.com, its owners, affiliates, officers, employees, and agents (collectively, “We,” “Us,” or “Our”) make no representations or warranties, express or implied, as to the accuracy, completeness, timeliness, reliability, or suitability of the information contained on or accessed through this Website. Further read Disclaimer.